The publishing feature in Datalore works great apart from a few minor issues:
See: lets_plot_titanic
-
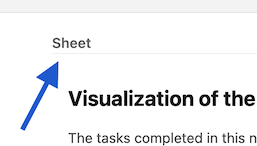
Seemingly unnecessary “title”:
-
The output in Datalore is at least 40 px narrower than in Kaggle.
Not an issue per se but a wider output is often preferable.
Compare to the Kaggle’s copy: Titanic’s Voyage
Also, when migrating from Kaggle to Datalore I have to change the code to adjust plot sizes and this is not really apparent while in editing mode.
Possible feature: in the editing mode be able to see the cell margins when published.