I am using the mpld3 library to make my matplotlib zoomable.
Here is a simple example:
import matplotlib.pyplot as plt
import mpld3
mpld3.enable_notebook()
%matplotlib inline

plt.plot([1, 2, 3], [1, 2, 3])
plt.show()
On a regular Jupiyer notebook this works as expected: once hovered over the graph there will be some buttons displayed in the bottom left corner.
However, on Datalore the same code still produces a static image without showing any errors or warnings.
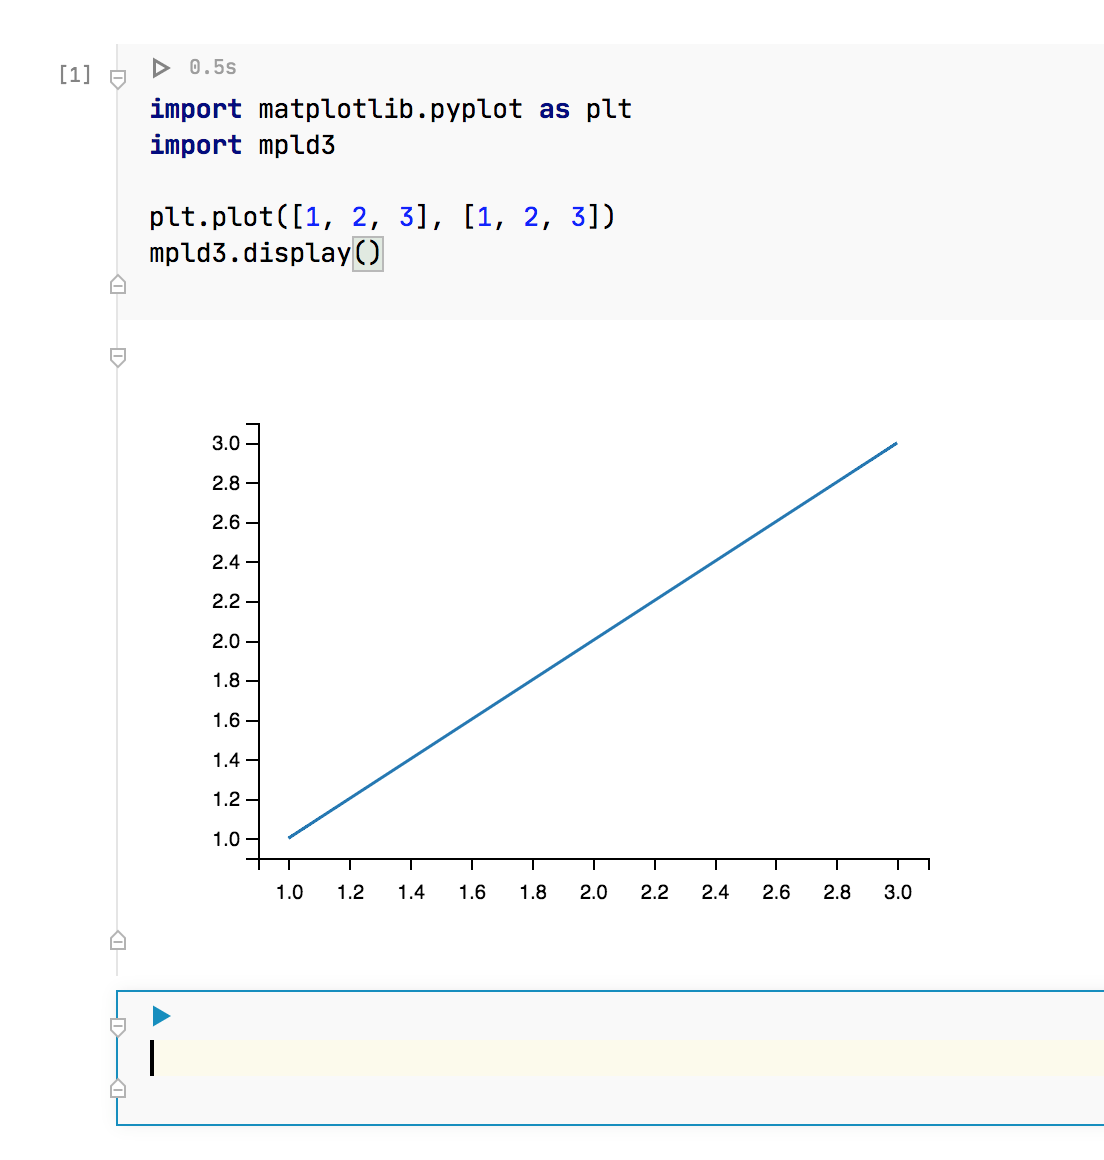
After some research and guessing I got it working on Datalore as well with the following modification:
import matplotlib.pyplot as plt
import mpld3

plt.plot([1, 2, 3], [1, 2, 3])
mpld3.display()
However, the grap is now so big that it does not fit properly into the window. The same code produces a correctly sized graph on regular Jupyter notebooks.