Hey, we use the visualisations from the Let’s Plot library to build reports, but unfortunately these cells are always shown with scrollbars and not resized properly. I already tried using + ggsize() to make the plots smaller, but this seems to only affect the output in the notebook view but not in the report view.
Hi @lukas,
Could you please send me a link to such a report? I didn’t manage to reproduce this issue on various simple plots. Do you use custom zoom in the browser? Please also specify your browser and OS.
Thank you!
Best regards,
Igor Medovolkin
QA Engineer in Datalore
I sent you one via DM as we use a self-hosted instance of datalore:
I’m using MacOS with Chrome and not custom zoom
@igro Any news on this? Having the scrollbars in the report view makes Datalore a lot less user-friendly
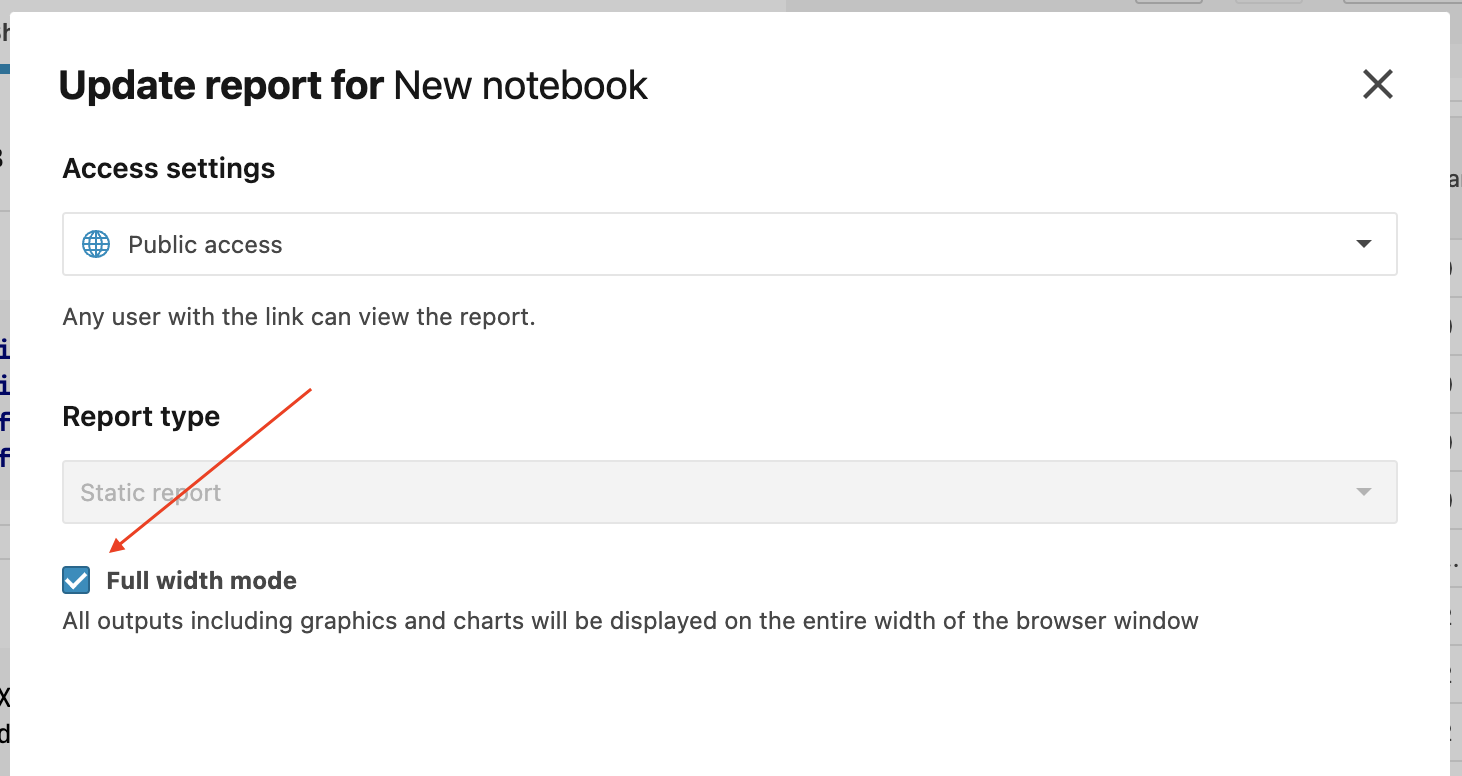
@lukas, I’m sorry for the lack of responses from my side. It seems, you have disabled “Full width” mode in the report settings, please try enabling it back:
Thank you!
Best regards,
Igor
Hi @igro,
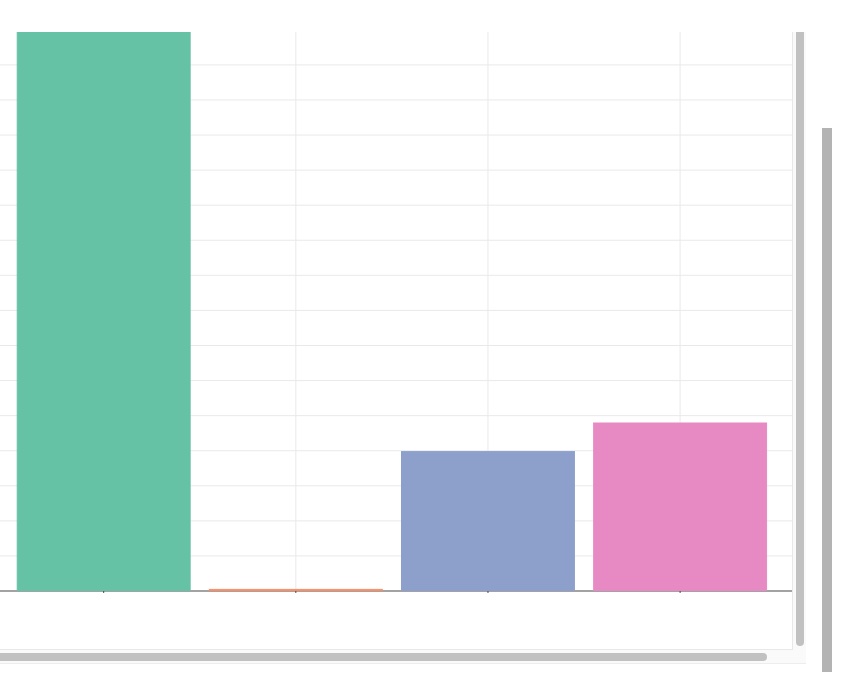
even with the full width mode enabled the report looks like this:
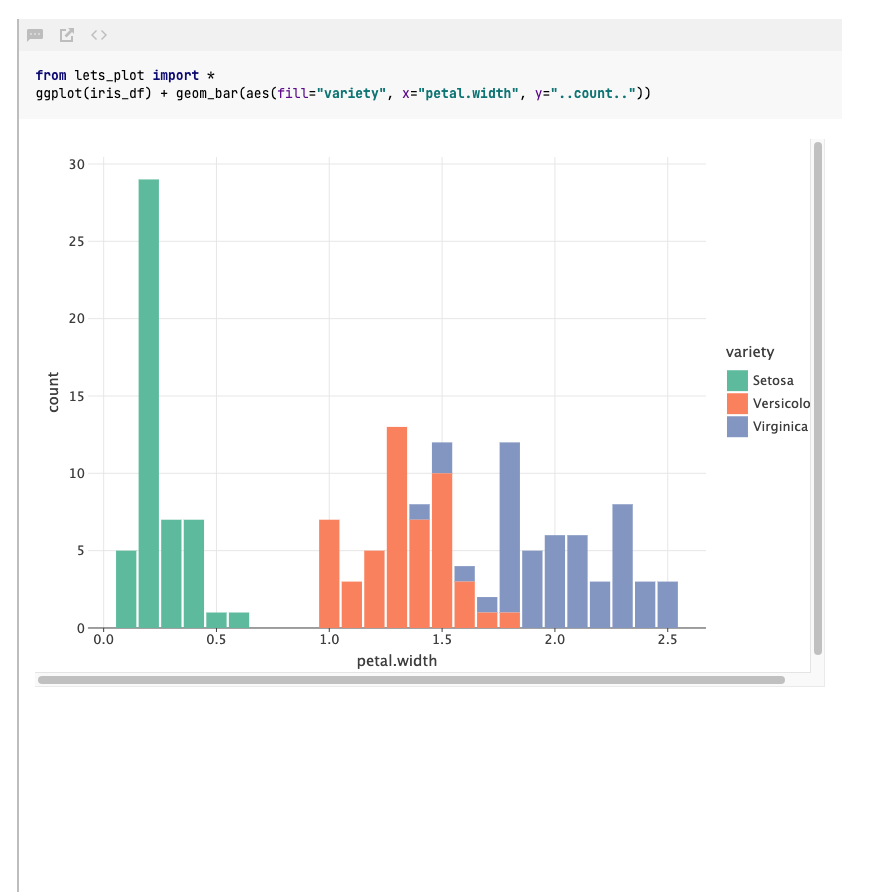
In the notebook everything looks fine:
@igro this error still persists and forces us to use plotly instead of let’s plot for reports. Any news when this will be fixed?
@igro Any news? We would really like to use Let’s Plot together with datalore, but are now limited to alternatives like Plotly.
Hi @lukas!
I didn’t manage to reproduce the issue last time, but this time I managed to get the scrollbars by resizing the viewport multiple times in Chrome - normally scrollbars are displayed right after I resize the viewport and removed once the chart is completely rendered, but in some random cases scrollbars persist until I reload the page. Firefox and Safari seem to be not affected - there scrollbars always removed once rendering is finished.
I will ask frontend devs to look into it, but could you also provide more details on your environment if it always reproduces for you when you just open the report page? (Datalore Enterprise version, OS + version, browser + version, maybe some specific extensions installed?). Thank you!
Thank you @igro and glad you were able to reproduce it! I tried it with safari and indeed there the scrollbars are gone.
Here is my environment:
- Datalore Enterprise 2023.5.1
- Chrome Version 120.0.6099.234 (Official Build) (arm64)
- macOS 14.2.1 (23C71)
- I do have uBlock installed, but even with all extensions deactivated I can reproduce the scrollbars in chrome
1 Like
@igro do you already have an estimate when the team will look into it? ![]()
@lukas , good news, colleagues behind the Let’s Plot library found an issue on their side, the fix is already in master and will be available along with the next release (4.3.3).
1 Like
Thanks Igro!
1 Like