Hello, I’m using Datalore to learn data analysis for me.
This is my code
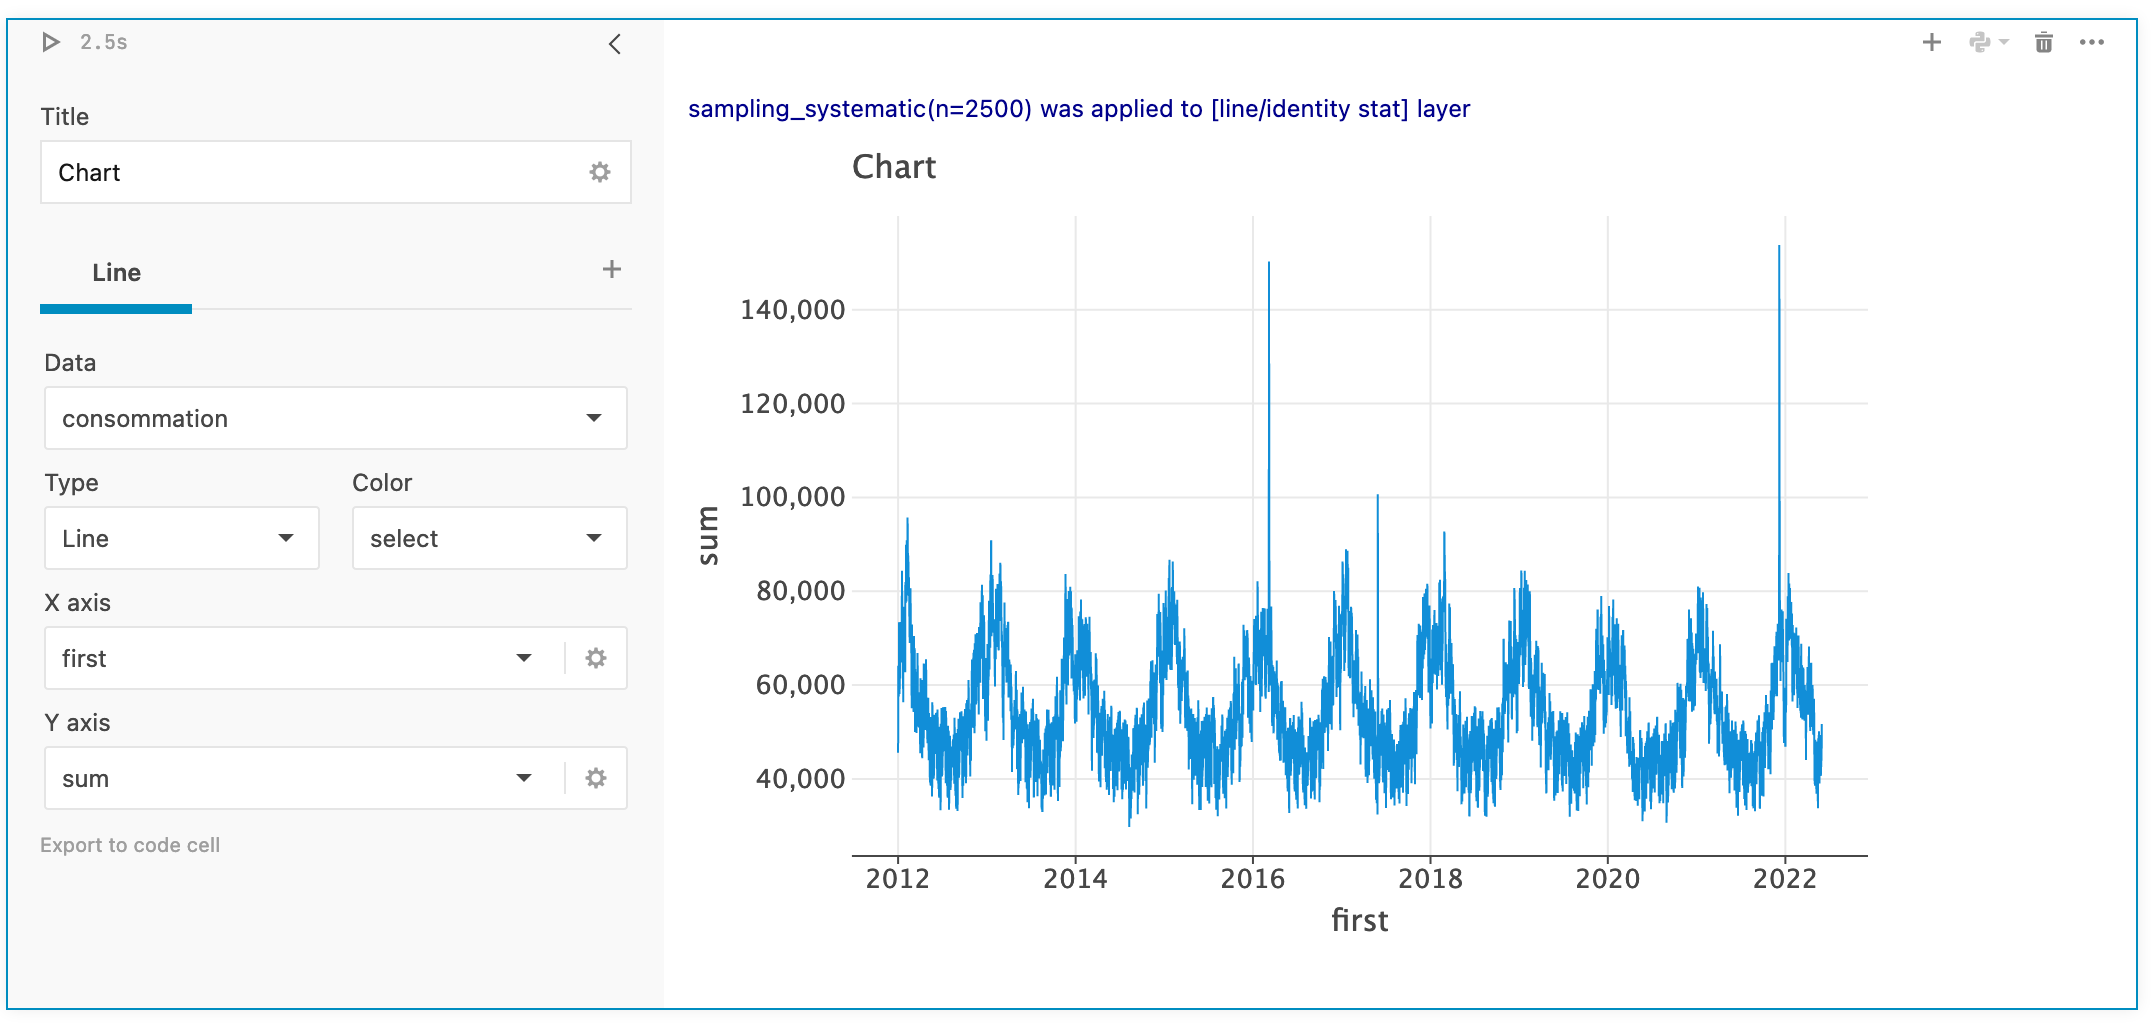
consommation=consommation_brute[consommation_electricite_filter].groupby(['date_format_day', 'consommation_brute_electricite_rte'], as_index=False).agg({'consommation_brute_electricite_rte': ['sum', 'mean'], 'date_format_day': 'first'})
# consommation.columns = consommation.columns.droplevel(0) // uncomment to fix issue
When I create a chart using the “Chart cell” component, I got the following error :
Internal error: NullPointerException : <no message>
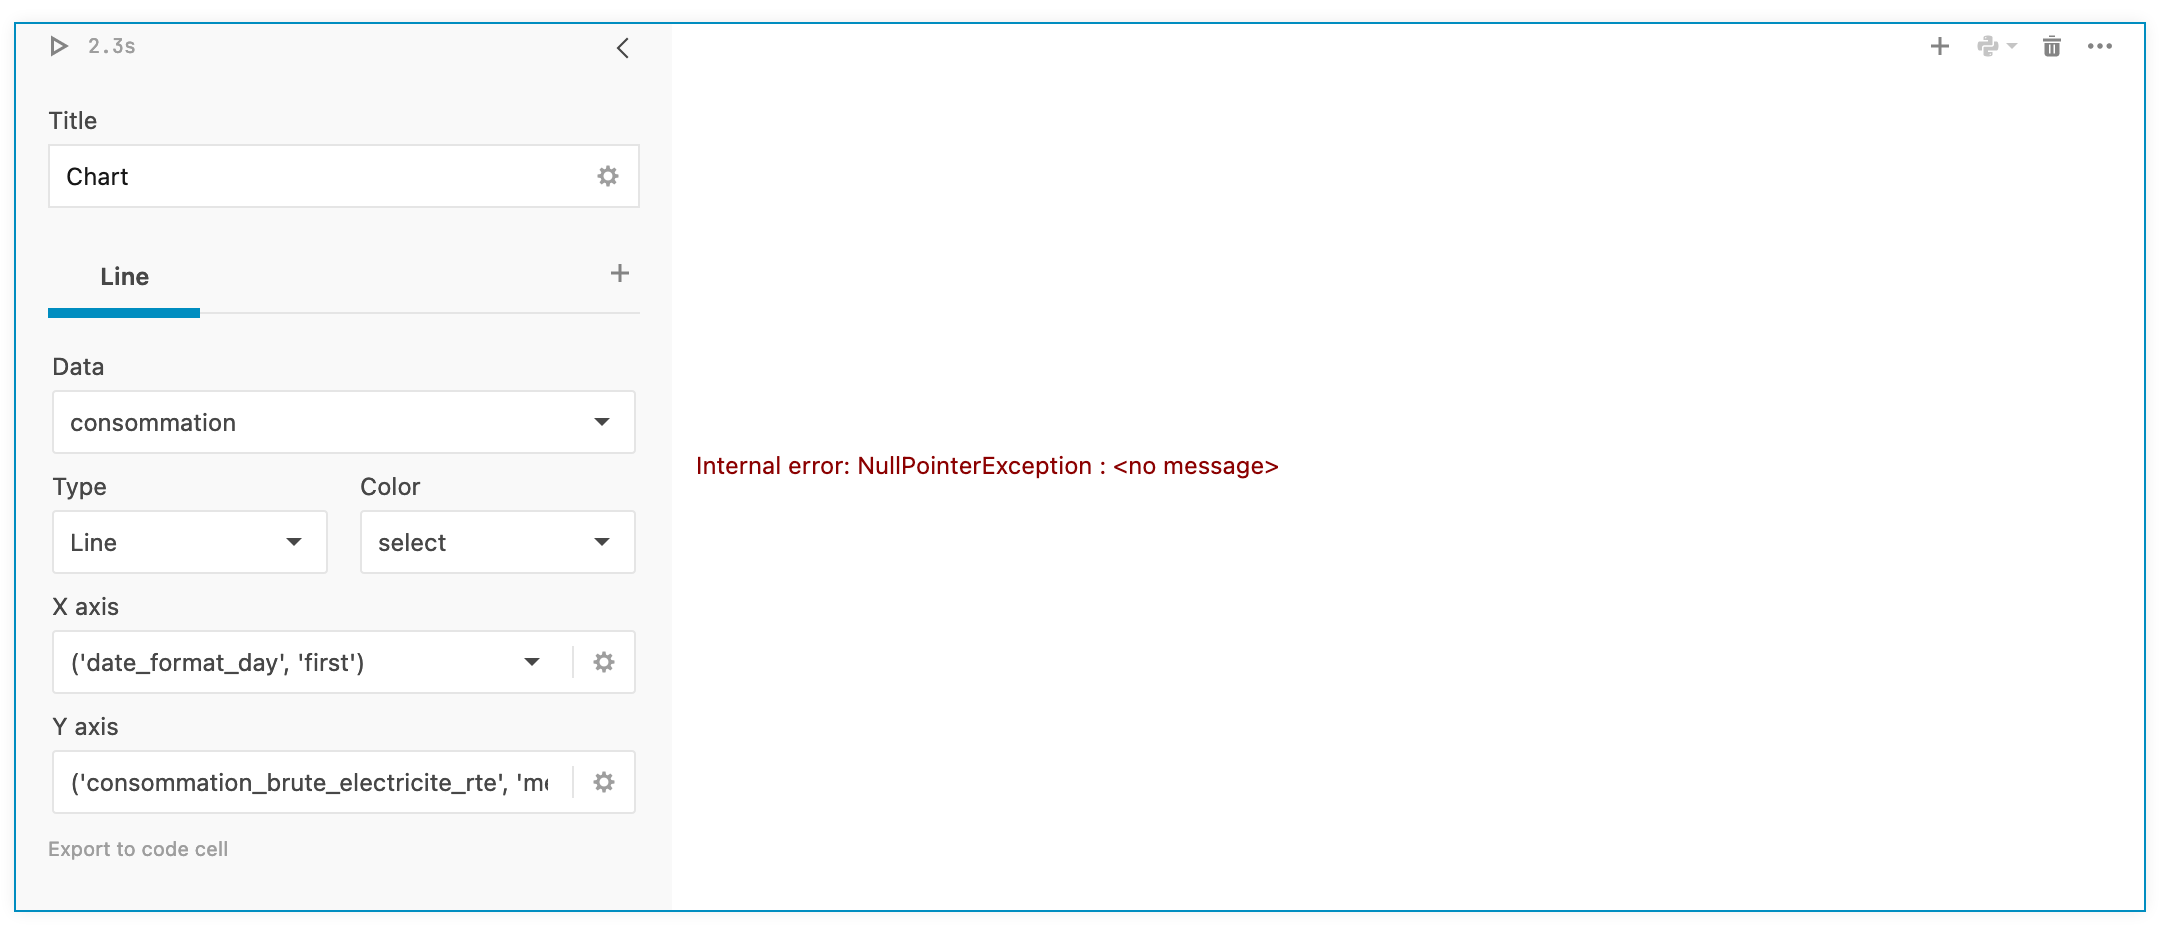
To fix it, I need to uncomment the line to delete the first column, but I only have access to “subgroup” in the X axis and Y axis.
IMAGE IN FIRST THREAD RESPONSE (limit of 1 media per post when new user)
Thanks for your help! Or maybe a bug, IDK