Hi,
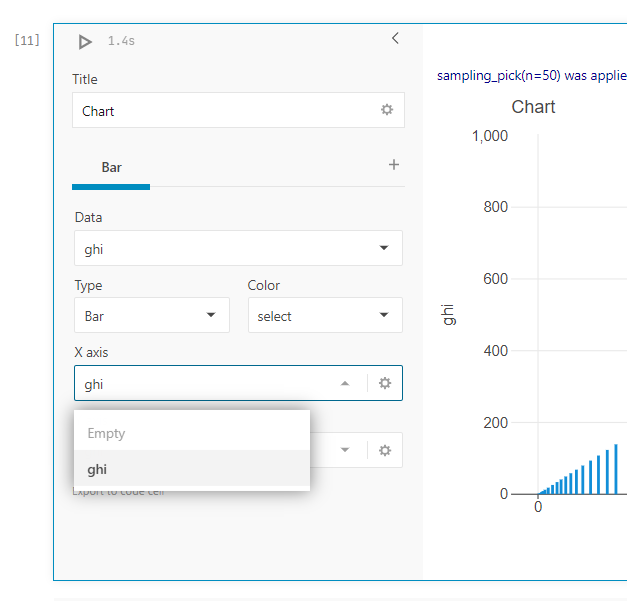
I’m trying to use the dataframe index as the x-axis in a Datalore chart cell but the index isn’t presented as an option which seems strange?
Any help or explanation would be appreciated.
Chart cell:
Thanks